How I Made $290,000 Making 1 Video a Month (Full Breakdown)

Visual Siblings
Screens that share similar strategies
Attention Analysis
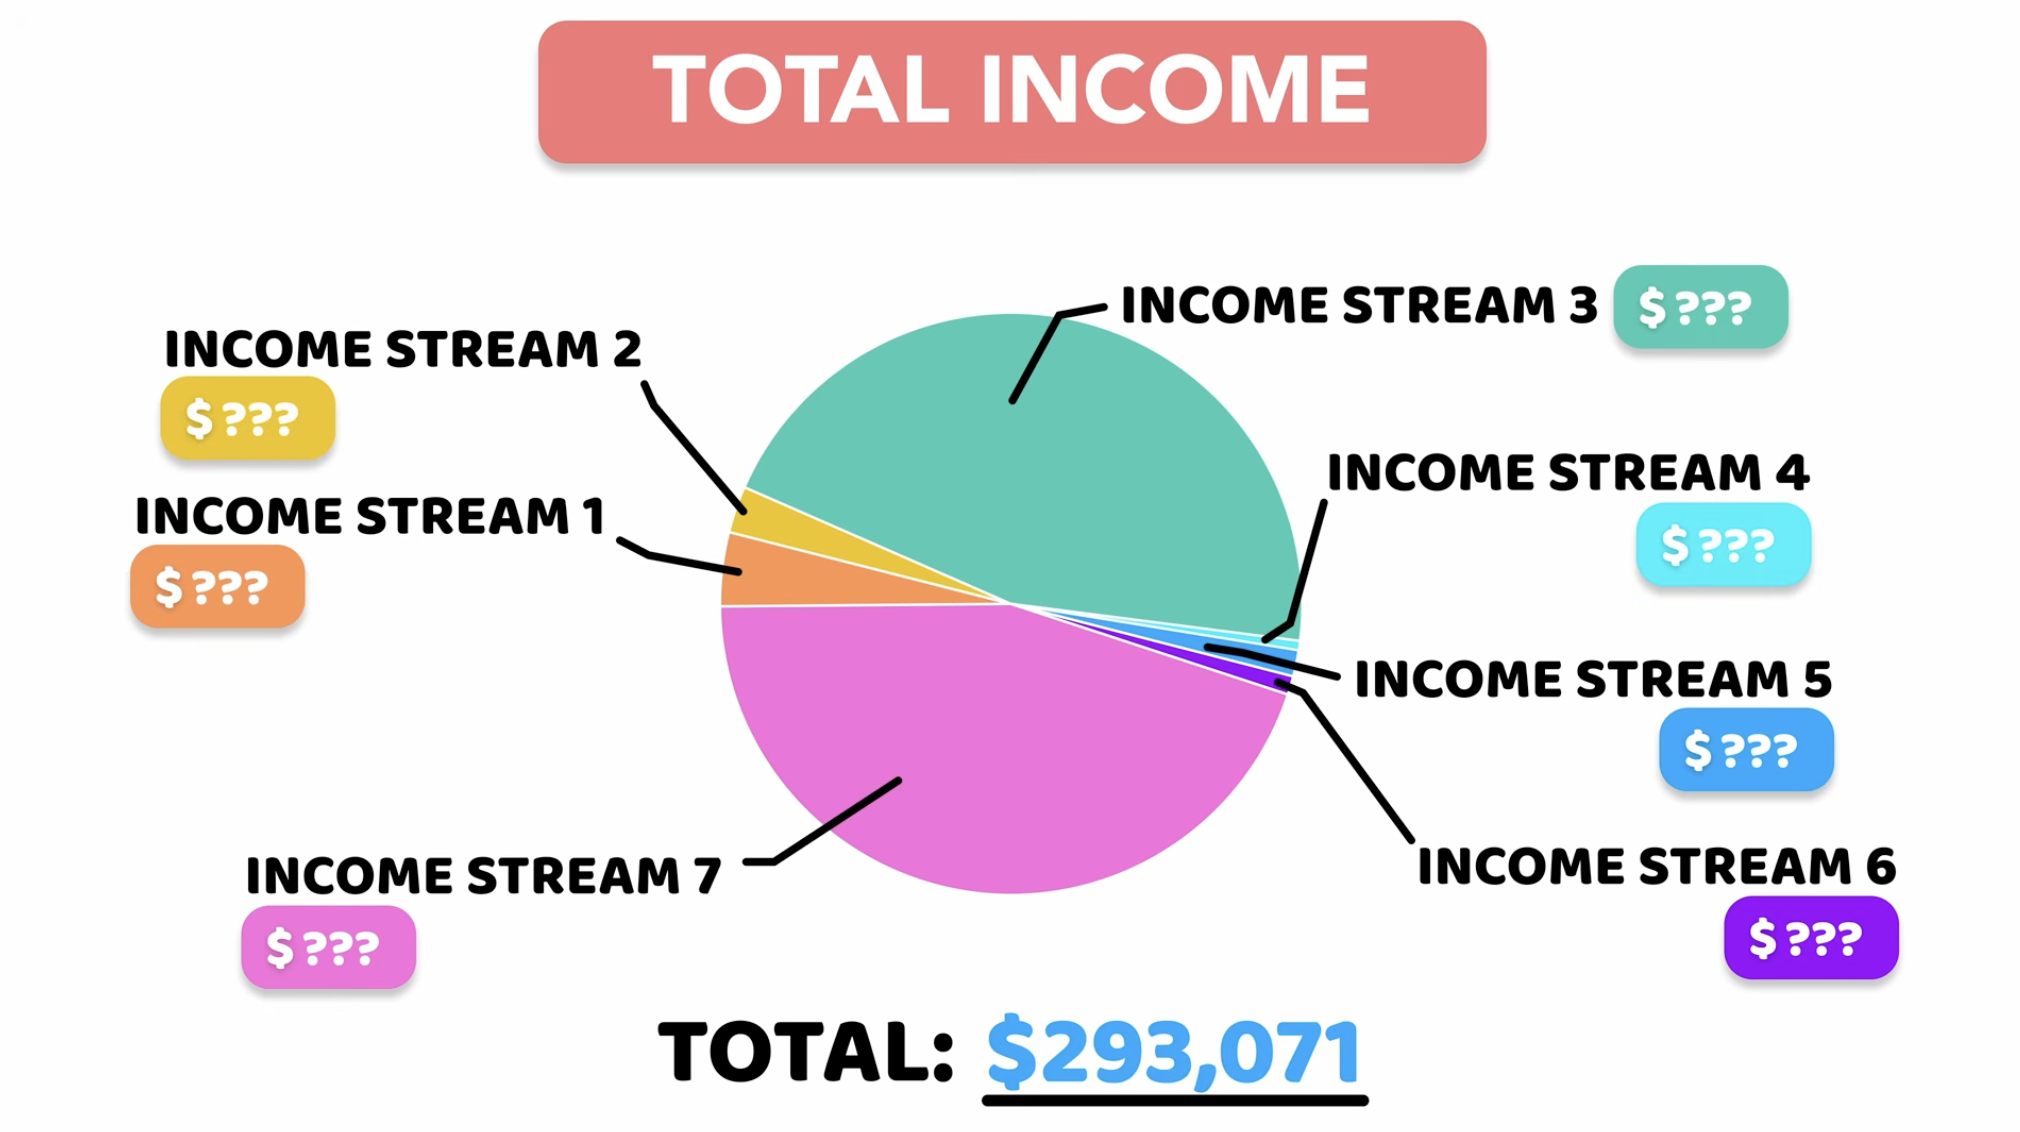
The pie chart immediately communicates revenue diversification and relative contribution of each income source.
Color-coded labels create quick visual mapping between categories and chart segments.
The hidden dollar amounts maintain curiosity while still showing the structure of the business.
The large total figure acts as the primary anchor and key takeaway.
The slide resembles a presentation deck rather than a traditional charting tool, making it creator-friendly.
Category:Graphics Slides
Color Palette
light gray
pink
teal
cyan
yellow
purple
orange
blue
Brightness: high key
Contrast: medium high
Colors: 8
Visual Siblings
Screens that share similar strategies