How I Made $290,000 Making 1 Video a Month (Full Breakdown)

Visual Siblings
Screens that share similar strategies
Attention Analysis
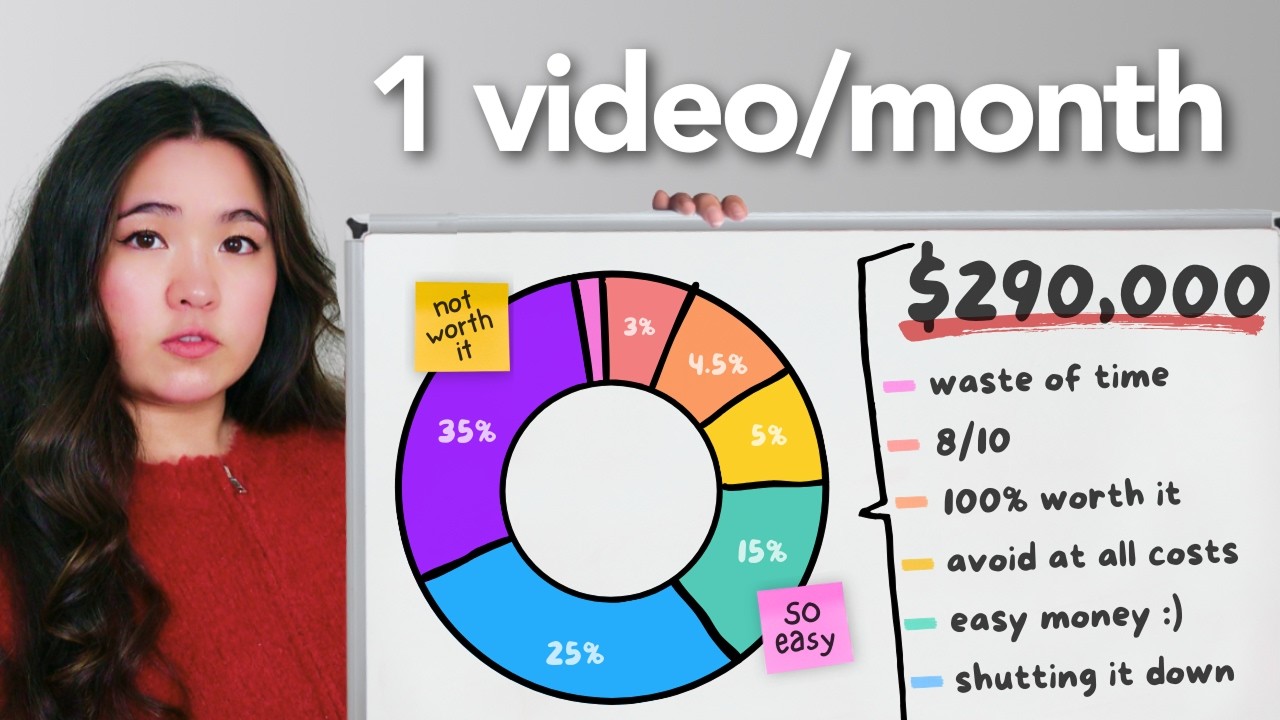
Combines a human face with a clear numerical outcome, creating immediate curiosity.
The donut chart acts as a visual promise that a detailed breakdown will follow.
The large revenue figure is the primary attention anchor.
Sticky notes add personality and reduce the formality of the financial content.
The clean whiteboard aesthetic signals education and transparency.
Category:Thumbnails
Color Palette
light gray
white
purple
blue
teal
yellow
orange
pink
red
Brightness: high key
Contrast: high
Colors: 9
Visual Siblings
Screens that share similar strategies